Where to start looking for insights in your reports
The RoboHead Spark Report Analyst can answer an endless number of questions depending on the report type and which columns you select, providing additional insights into your time, worker, and budgetary allocations. With so many possibilities, it can be tough to know where to start.
Ask about the data in front of you
The Spark Report Analyst can answer many questions about your account; all you have to do is run the report and start asking questions about it. The Spark Report Analyst does what it says in the name—analyzes the report you’re currently looking at.
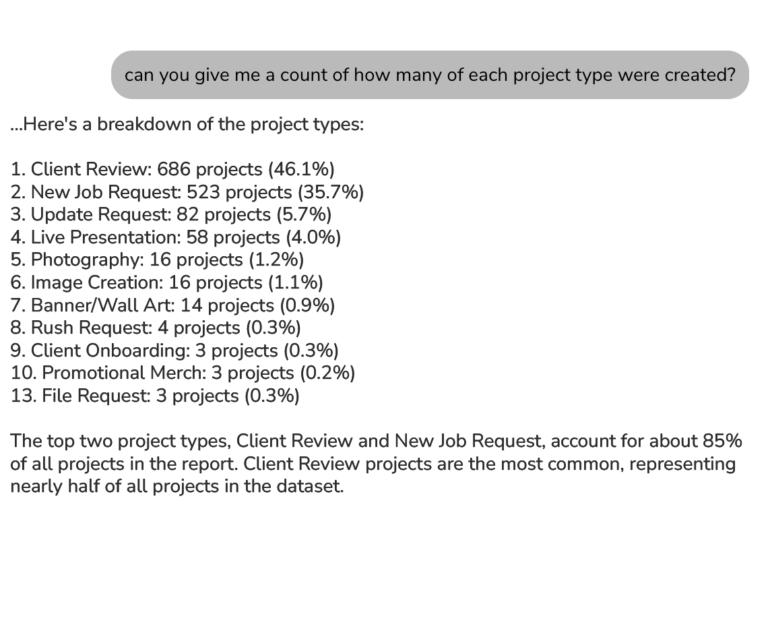
Can I get a count of that?
Can you give me a breakdown of how many projects there are of each project type? Can you tell me how many tasks were assigned broken down by Task Role? Can you give me a breakdown of how many Actual Hours were logged this year for each client? This simple question can allow you to gather a lot of information quickly that gives you the backing you need to request more headcount, allocate more of your team toward a certain project type, or to go back to your client and renegotiate that contract.
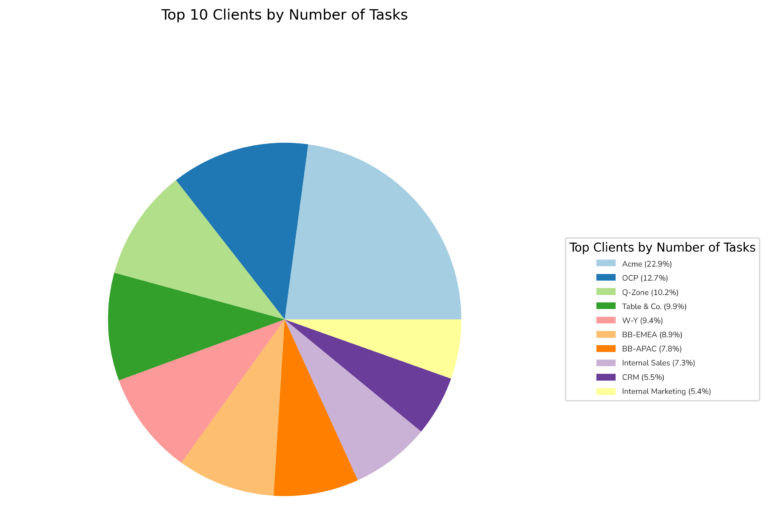
Can you create an infographic to represent my data?
The Spark Analyst can create a variety of visual representations of data, including pie charts, vertical and horizontal bar graphs, line graphs, scatter plots, histograms, box plots, and more. When you need to make a case for your team’s progress, nothing does the job better than a graphic that shows the line going up or the bar graph dipping. Because the analyst is flexible about what it can create, it’s worth asking this question as a follow-up to any request for further insight.
What can you tell me about trends in my data?
RoboHead helps you collect crucial KPIs and other data about your team’s projects over time. During that time, workers may join and leave the team, clients may appear or go away, and processes might change. If you added a new item to your team’s process for a given project type, you could ask for a comparison in actual hours on tasks before and after a particular date to show how that efficiency has improved your team’s productivity.
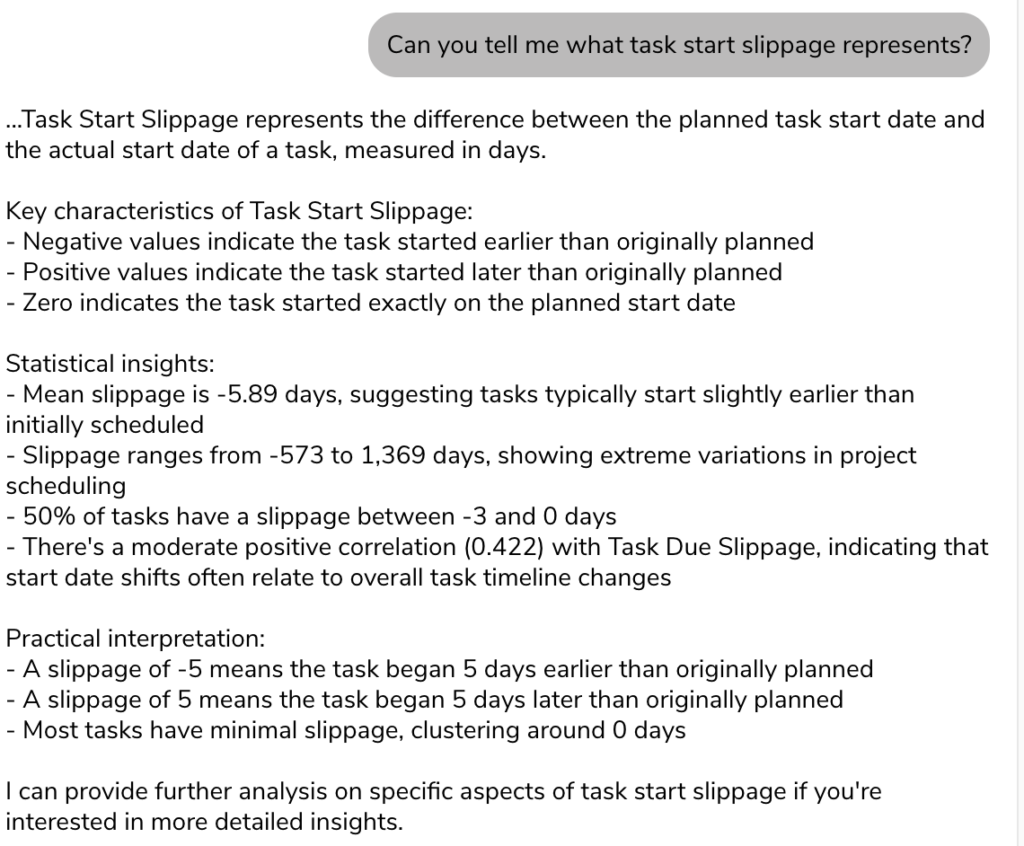
What does that field mean?
RoboHead has a variety of system fields that can provide deep insights into your reports, but with so many, it can be hard to remember what each one represents, such as fields like Task Start Shift and Task Start Slippage. We have Report Field Definitions available in our documentation, of course, but asking the Analyst allows you to stay in your report, and will give you additional insights about that field as it exists in your report. For example, in this report we asked the Analyst to remind us what the Task Start Slippage field is used for:
Who are the biggest contributors on my team?
All that work you’re assigning isn’t doing itself. Running a Task or Time report and exploring it with the Spark Analyst will let you see which team members are the biggest contributors, where they’re contributing, and how much time they’re putting in (if your team uses RoboHead to track time). Running a Project or Request report will let you see who is submitting the most work, and what kind of work they’re submitting. These kinds of insights will help you highlight standout users and clients, and understand what kind of work is being asked of and done by your team.

About the Author
Eric is the customer support specialist for RoboHead. In addition to being a friendly face behind our 24/7 support, he is also responsible for creating training and product materials. In his spare time, Eric enjoys cooking for his friends, writing, fixing computers, and gaming. He is also the owner of an orange cat.