What is it and how is it derived?

Written by Dan Perez — President, RoboHead
June 26, 2020
Three months ago, we all came into work thinking we had a pretty good grip on what we’d be working on for the next several months. New marketing campaigns, product launches, and customer events dotted the upcoming calendar, and resources and budgets were in place to get the work done. Then the world changed. Suddenly every decision was fraught with uncertainty and we all started struggling to adjust to an unpredictable economy and a shifting set of priorities.
Here at RoboHead, we started wondering how our customers were adjusting to this change. Obviously some industries were immediately impacted, but would companies not as directly impacted by the virus push forward with new marketing initiatives? We talked to customers who were adjusting to the new reality and wondering if their department’s experiences were in line with other companies. We, in turn, started looking at the activities of our customers and trying to see if we could determine how the activity level within marketing and creative departments had changed. As we looked at this data, it became clear that RoboHead’s 10,000+ users could provide some useful insights to not just our current customers but to the entire marketing & creative community.
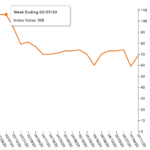
So what is the RoboHead 10000? Our initial goal was to answer a simple question – how much “work” do marketing & creative departments have at any given time? To answer this question, we looked at a variety of activities that take place during the project lifecycle, from intake through final sign-off. We decided to focus on a few key metrics that provide an accurate gauge of activity during all phases of a project: requests submitted, projects created, tasks assigned, notes created, reviews created, and review responses/approvals received. Combining these activities into a single index allows us to accurately gauge trends across a wide variety of marketing & creative groups.
To ensure the index remains consistent over time, we are not simply tracking the number of times these activities are occurring in RoboHead. As RoboHead adds new customers, our raw activity volume is, of course, growing year over year. To ensure the index remains consistent, we are first computing the average of two ratios for each event: the number of occurrences per RoboHead user active in the system during that period, and the number of occurrences per RoboHead account (companies/business units) active in the system during this period. Doing so provides a consistent value both as new companies start using RoboHead and as existing customers add new teams in RoboHead. Next, to provide a simple “anchor” to the data, we factor this raw measure by a constant such that the first working day, week, month and quarter of 2020 has a value of 100; other periods (both before and after) are expressed as a relative value to this initial period. Finally, the values for each activity are combined in a weighted average to produce a single measure for each period. For those of you who are mathematically inclined, here is the formula being used (for anyone else I apologize for any high school algebra PTSD this may induce).
First we compute the index value for each distinct activity:
((((x/u)*c)+((x/a)*k)))/2
x = number of occurrences during period
u = number of users is RoboHead during period
a = number of accounts in RoboHead during period
c = 100 / (num occurrences during first period 2020 / num users in RH during first period 2020)
k = 100 / (num occurrences during first period 2020 / num accounts in RH during first period 2020)
Then we combine the values for each period using a weighted average:
(p*.4)+(r*.12)+(v*.12)+(f*.12)+(t*.12)+(n*.12)
p = project creation index
r = project request index
v = review creation index
f = review response index
t = task assignment index
n = note creation index
In the future, we intend to add additional insights utilizing not just activities from RoboHead’s project management system, but also data derived from Aquent’s extensive marketing & creative staffing and services business. We look forward to hearing your feedback on the index and would like to hear your ideas on other insights that would be useful to you. Hopefully, we can help you see beyond what’s going on in your own department and get a birds-eye view on major trends in marketing & creative.